Industrial Assessment Guidance
Industrial Assessment Guidance
On this page: Background | Assessment Tools | Tip-Sheets | Meet the Team
The industrial sector represents a significant (26%) proportion of energy consumption in the U.S - that’s over 19,000 TBTU in 2018, per the U.S. Energy Information Administration. The accompanying emissions impact accounts for 30% of U.S. emissions (1,360 MMt CO2).
Assessment measures such as energy efficiency, alternative fuels and feedstocks, and electrification can lead to substantial reductions in energy consumption and related costs and emissions. Along the way, facilities can also benefit from these measures through improved equipment performance, increased productivity and lower maintenance costs.
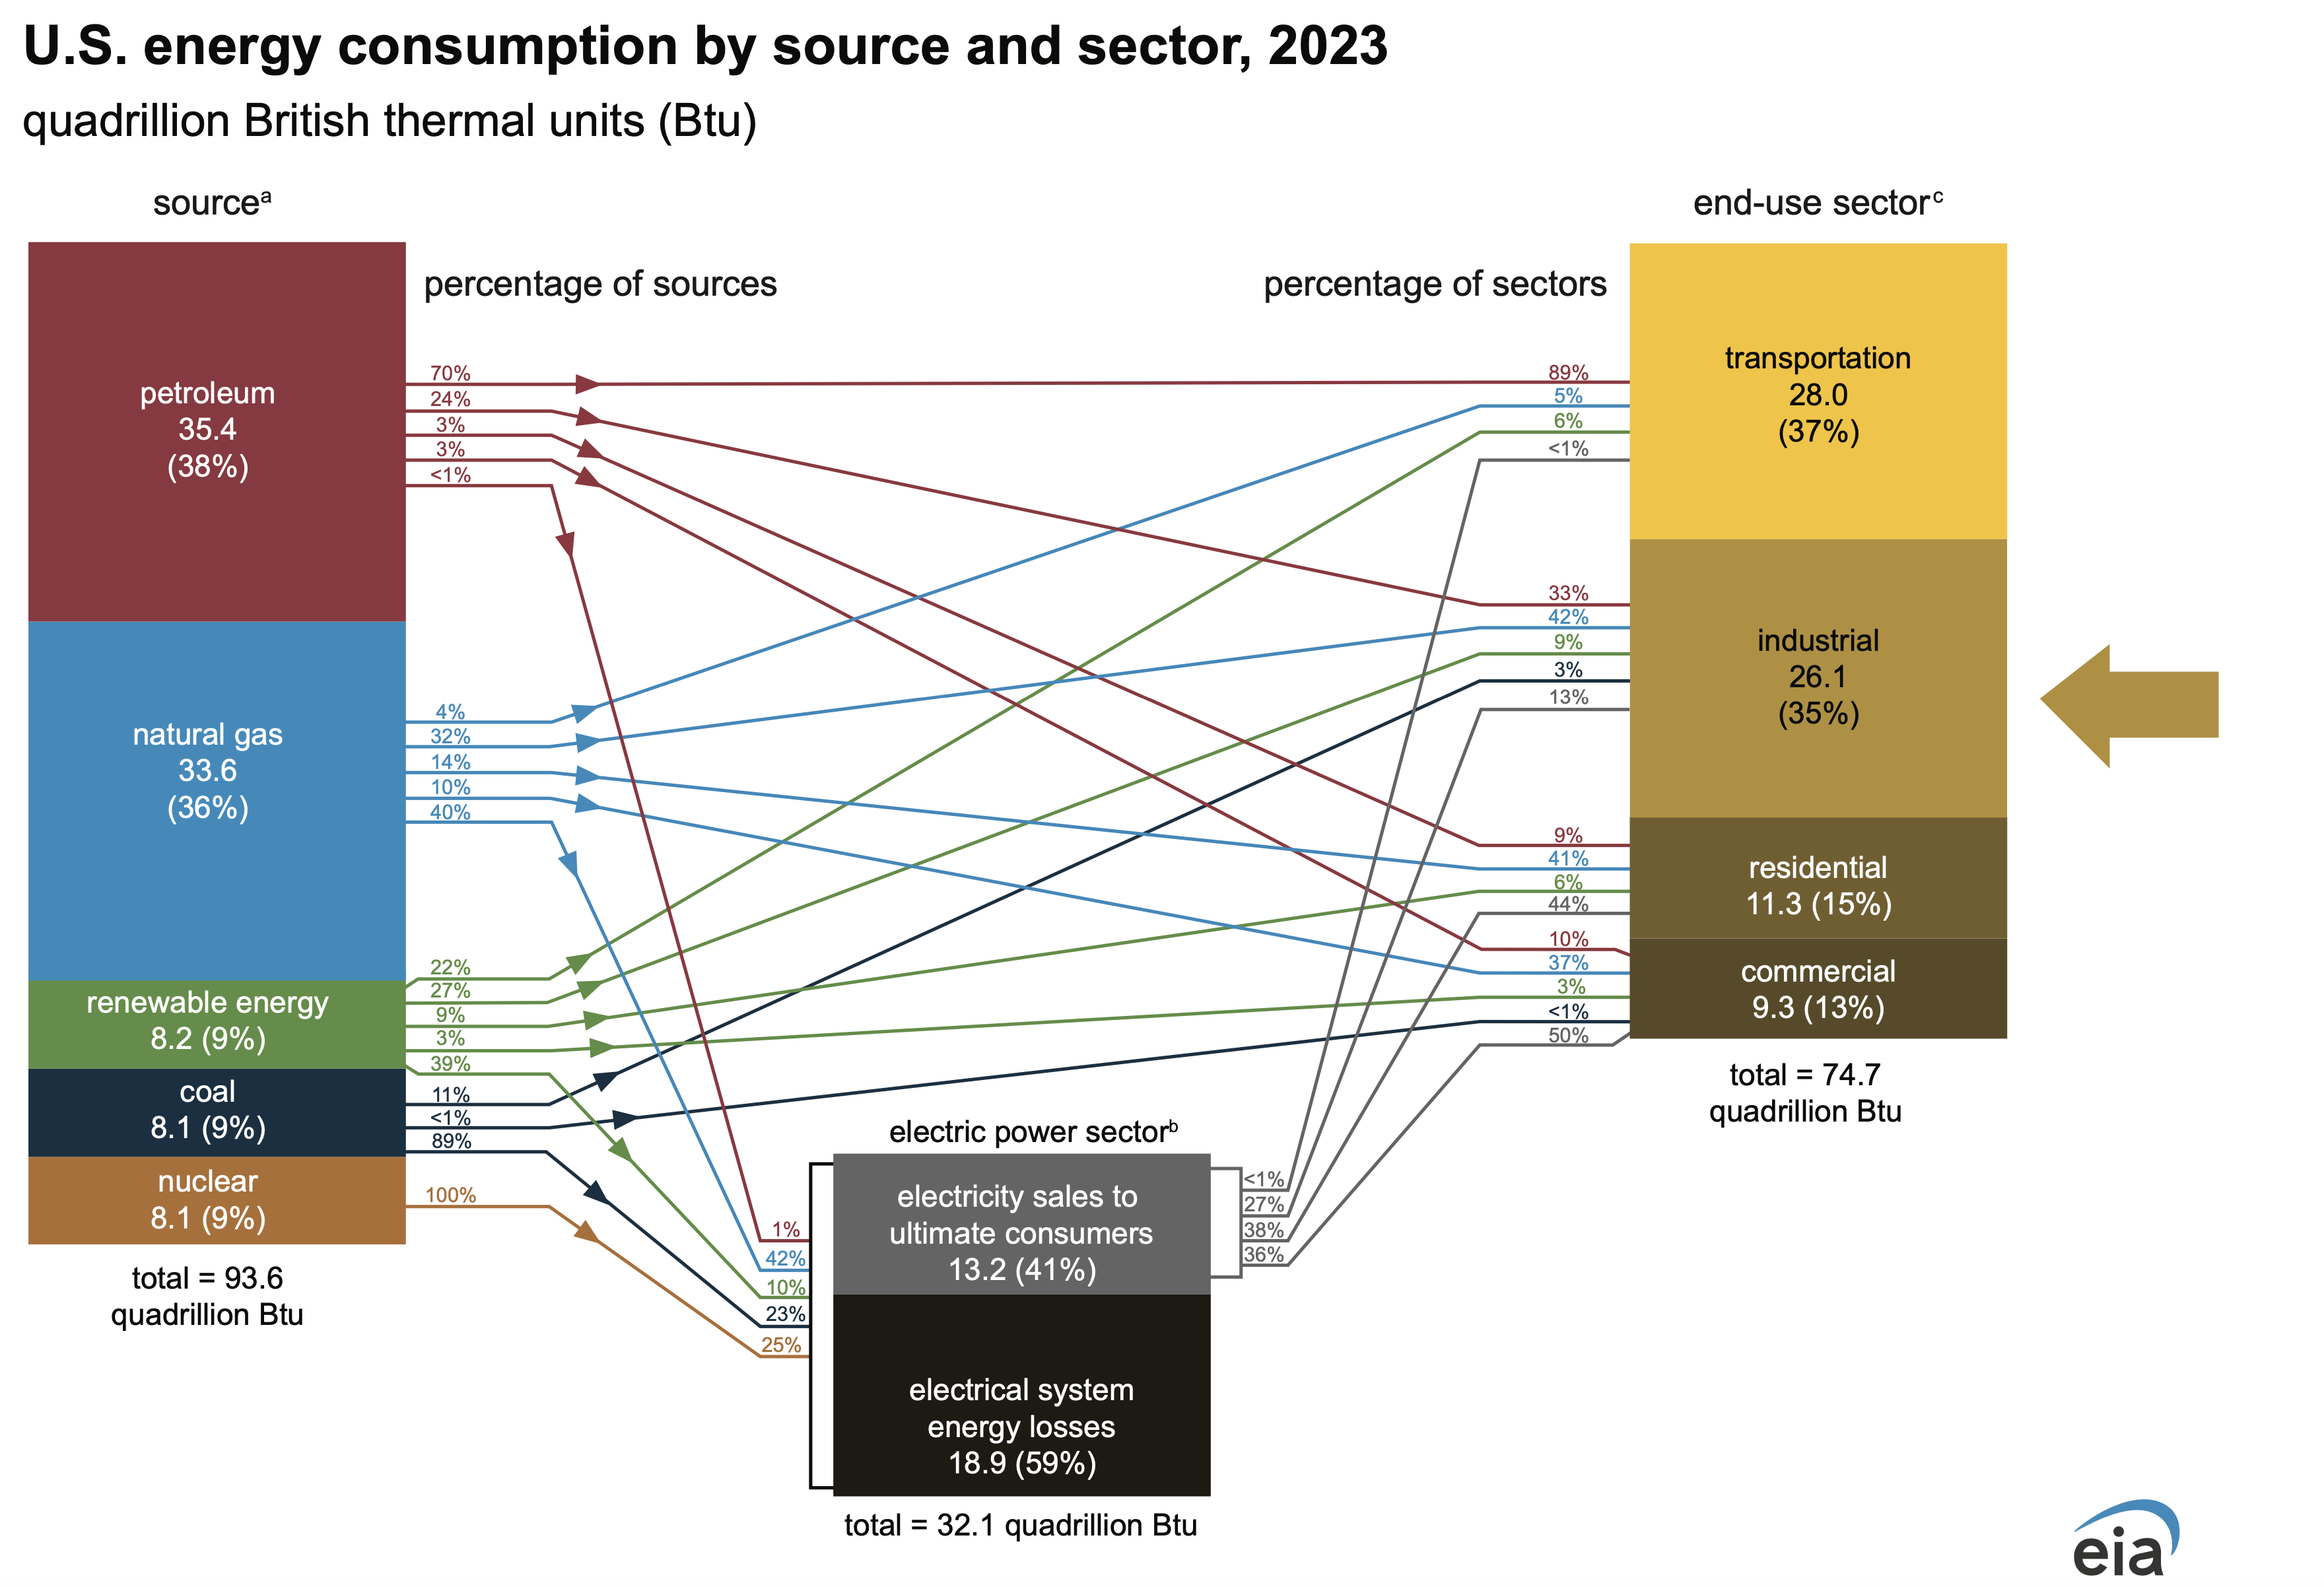
Data source: U.S. Energy Information Administration (EIA), Monthly Energy Review (April 2024), Tables 1.3, 1.4c, and 2.1a-2.6.
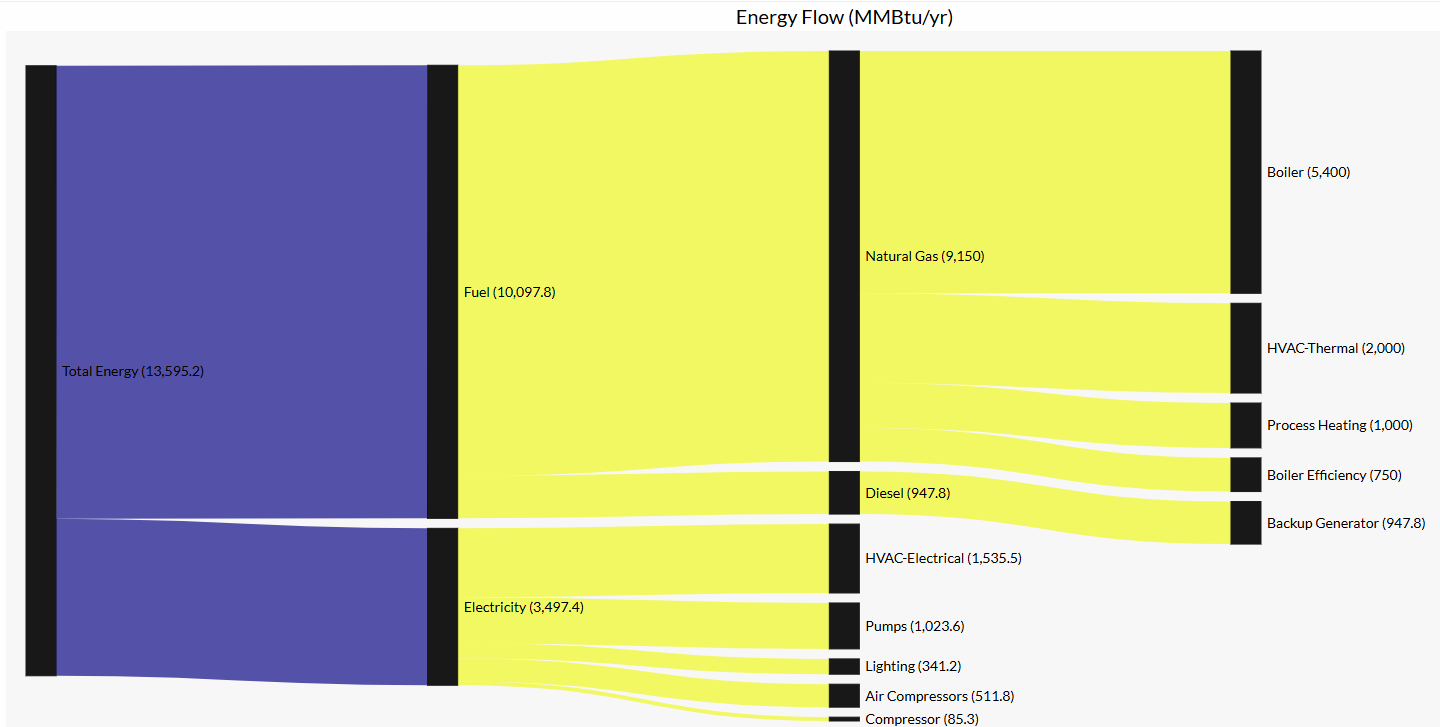
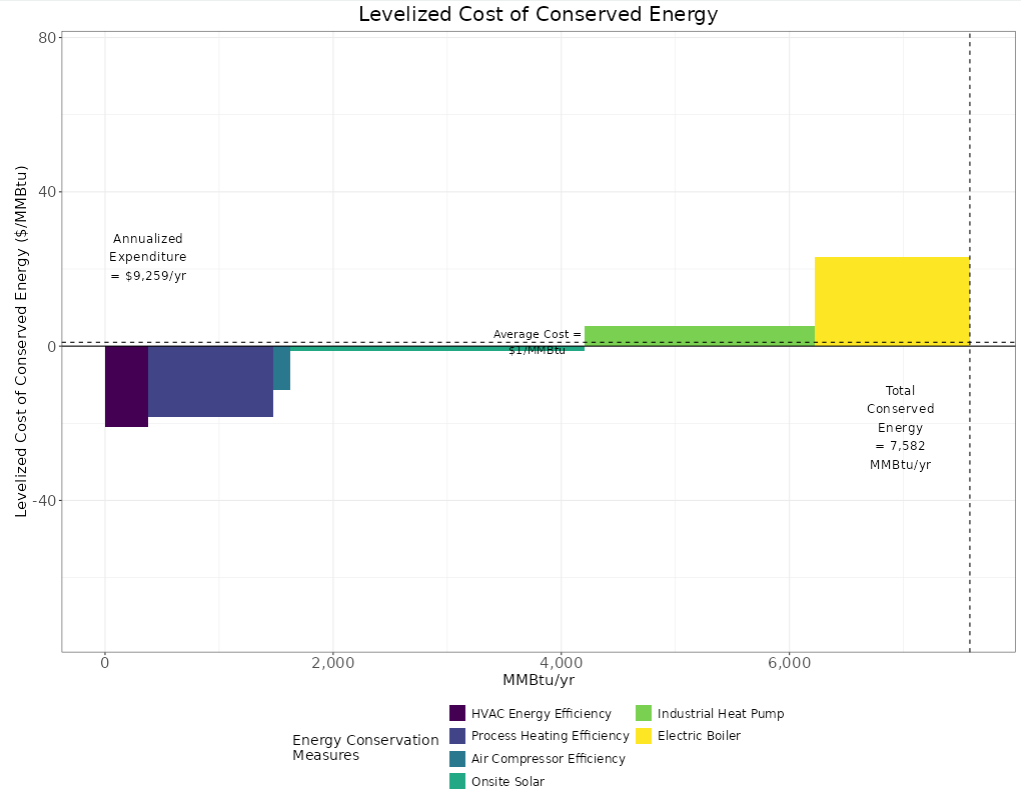
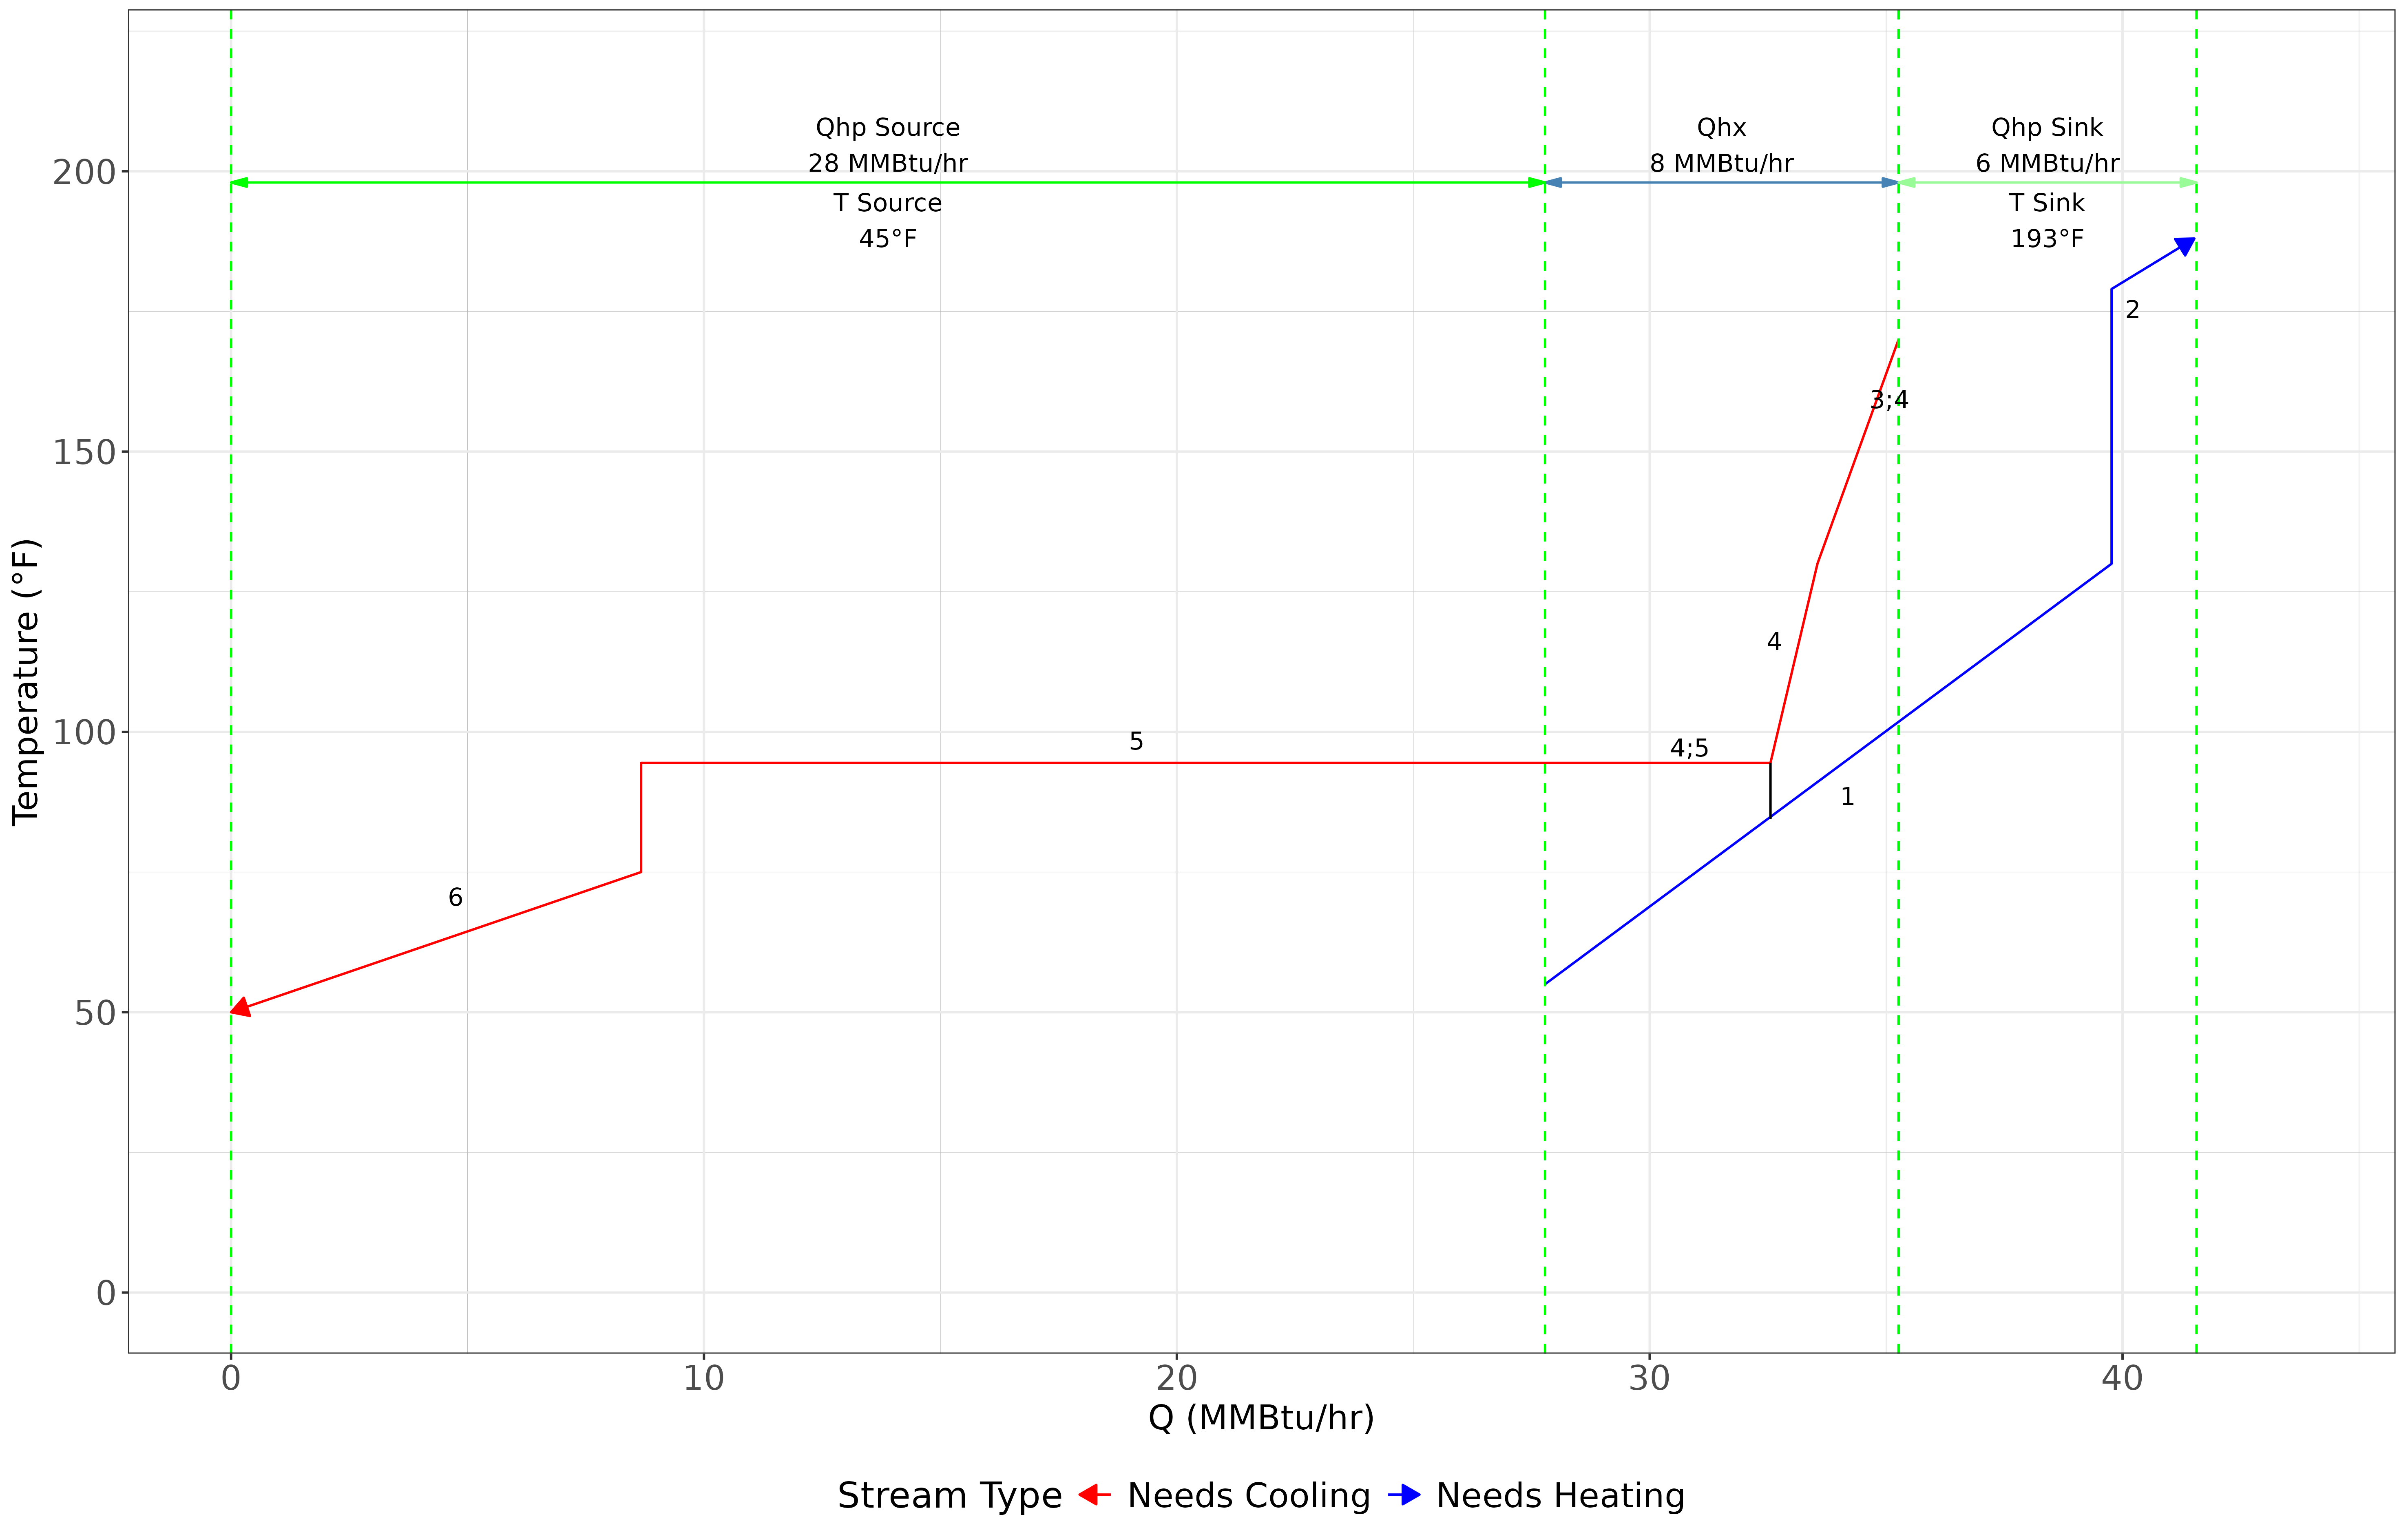
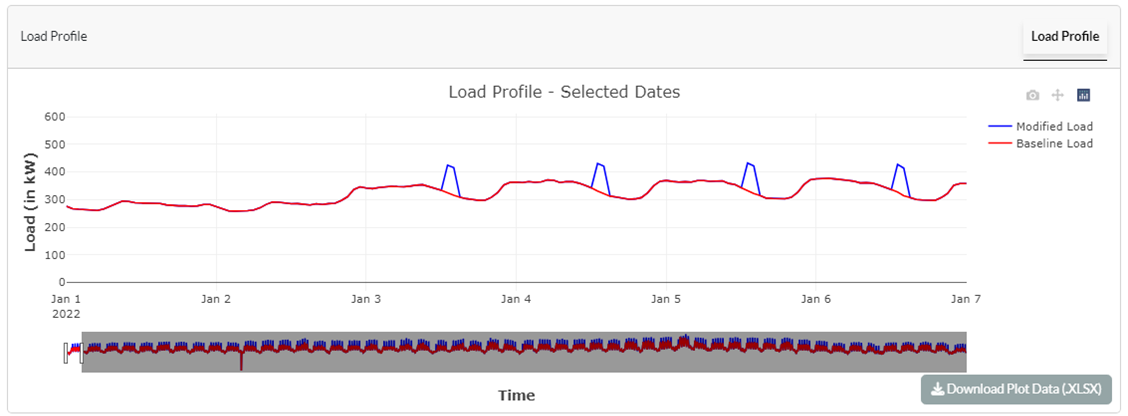
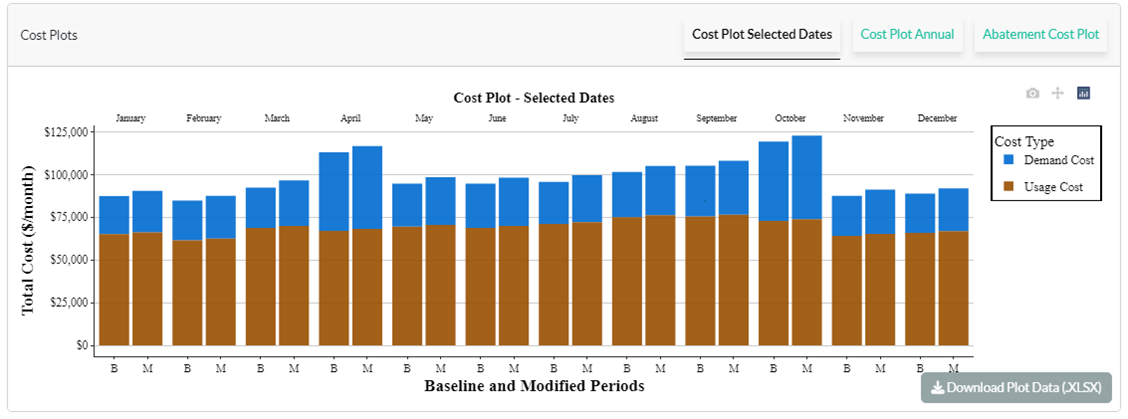
To support facilities’ journeys towards lowering energy costs, increasing competitiveness and meeting internal emissions goals, a team of researchers at Lawrence Berkeley National Laboratory (LBNL) and the University of California, Davis (UC Davis) have developed a set of online tools. Four tools - the Facility Sankey Tool, Levelized Cost Curve Tool, Pinch Heat Integration Tool, and Electric Load Planning Tool- are currently available for use.
These free tools are available for anyone, from students and faculty to consultants and companies, to use in techno-economic evaluation and prioritization of energy conservation and decarbonization measures.
This project is part of a collaborative effort on industrial energy efficiency between researchers at LBNL and UC Davis. The tools were originally developed to support the technical assessments conducted by the U.S. Department of Energy Industrial Assessment Centers in line with the program’s objectives. For more information on Industrial Assessment Centers, visit the Department of Energy’s IAC webpage.
Industrial Energy and Productivity Tip-Sheets
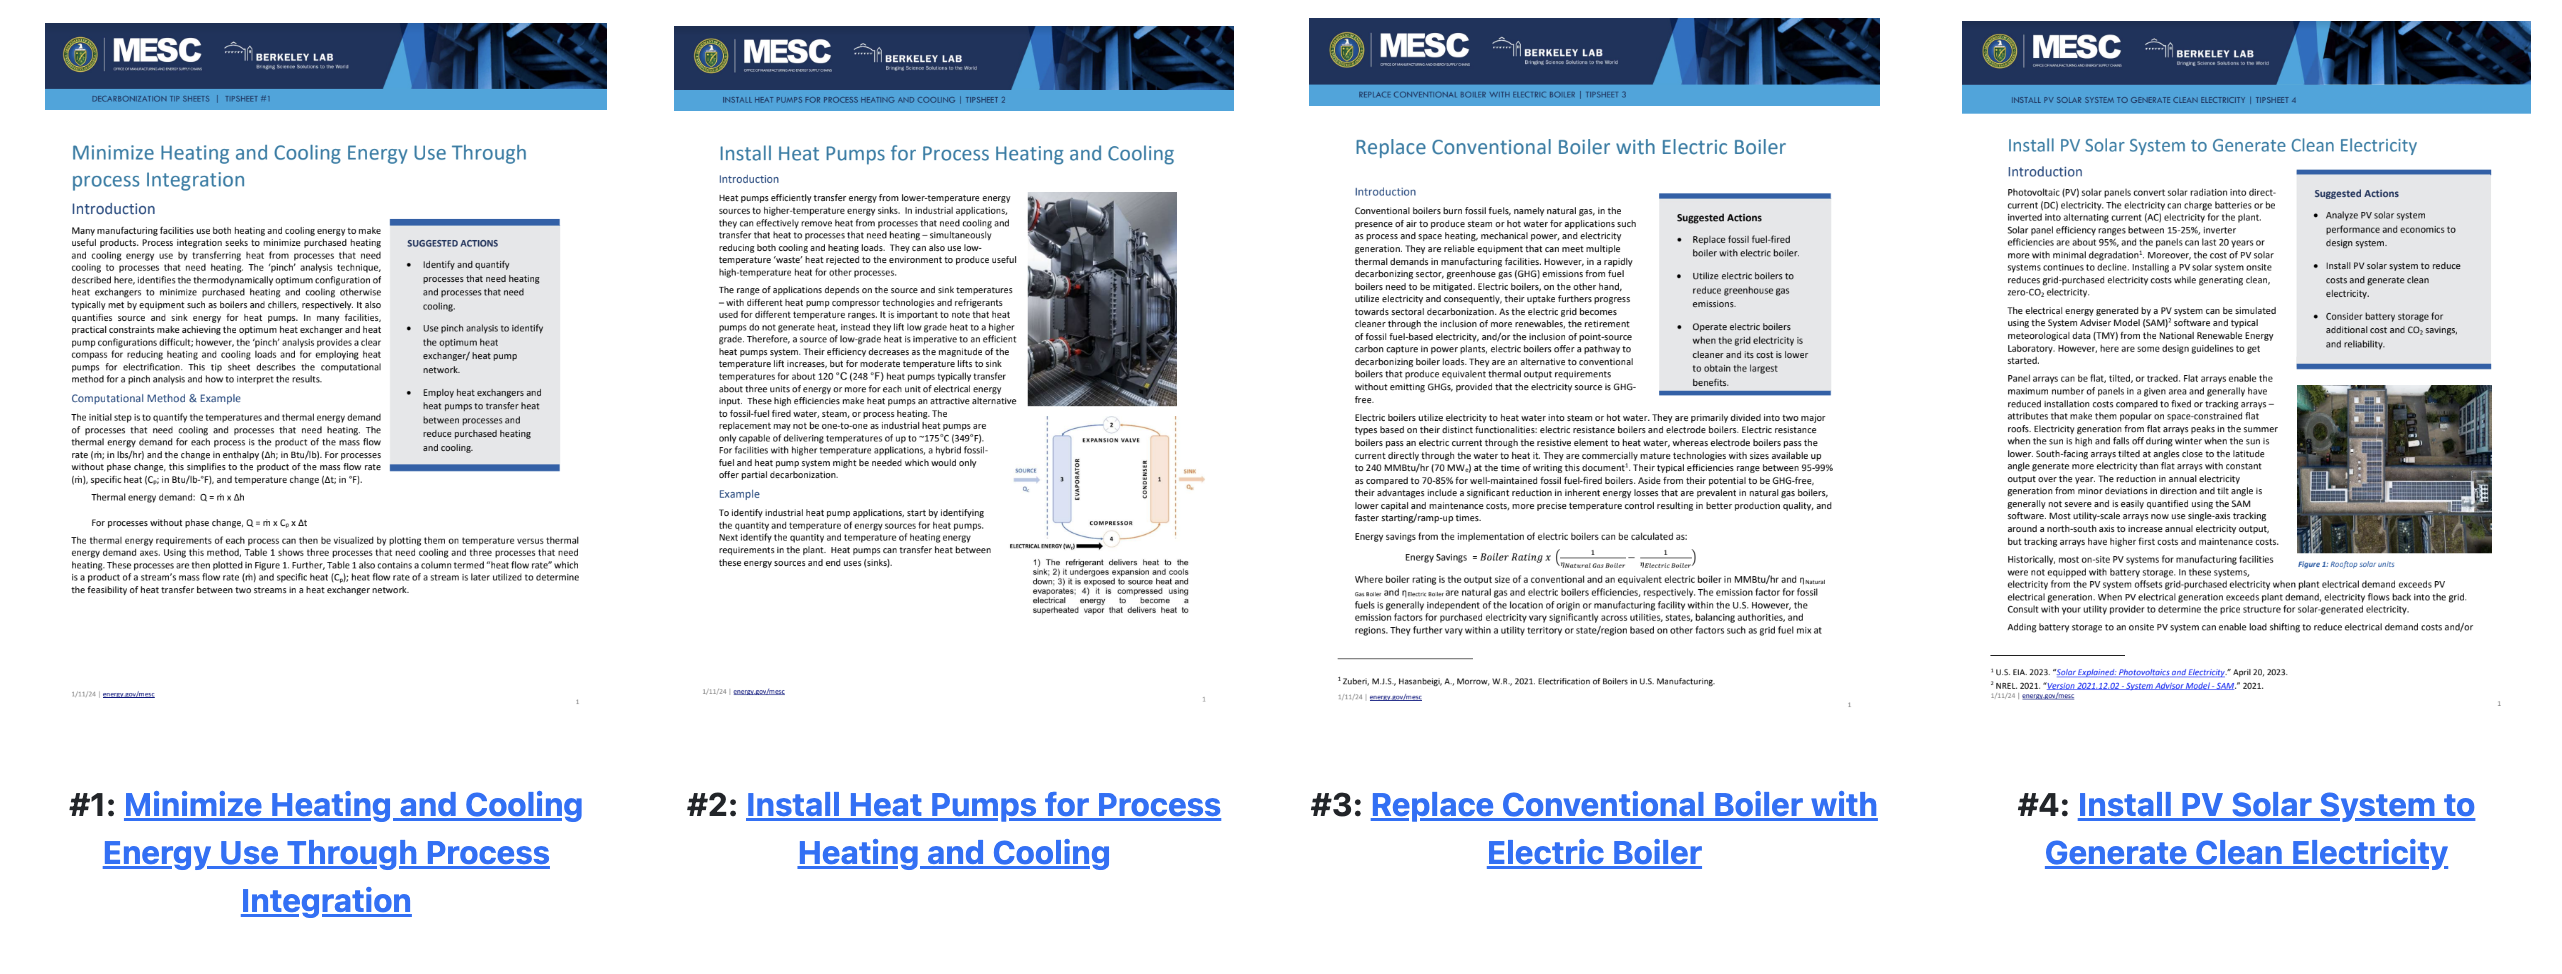
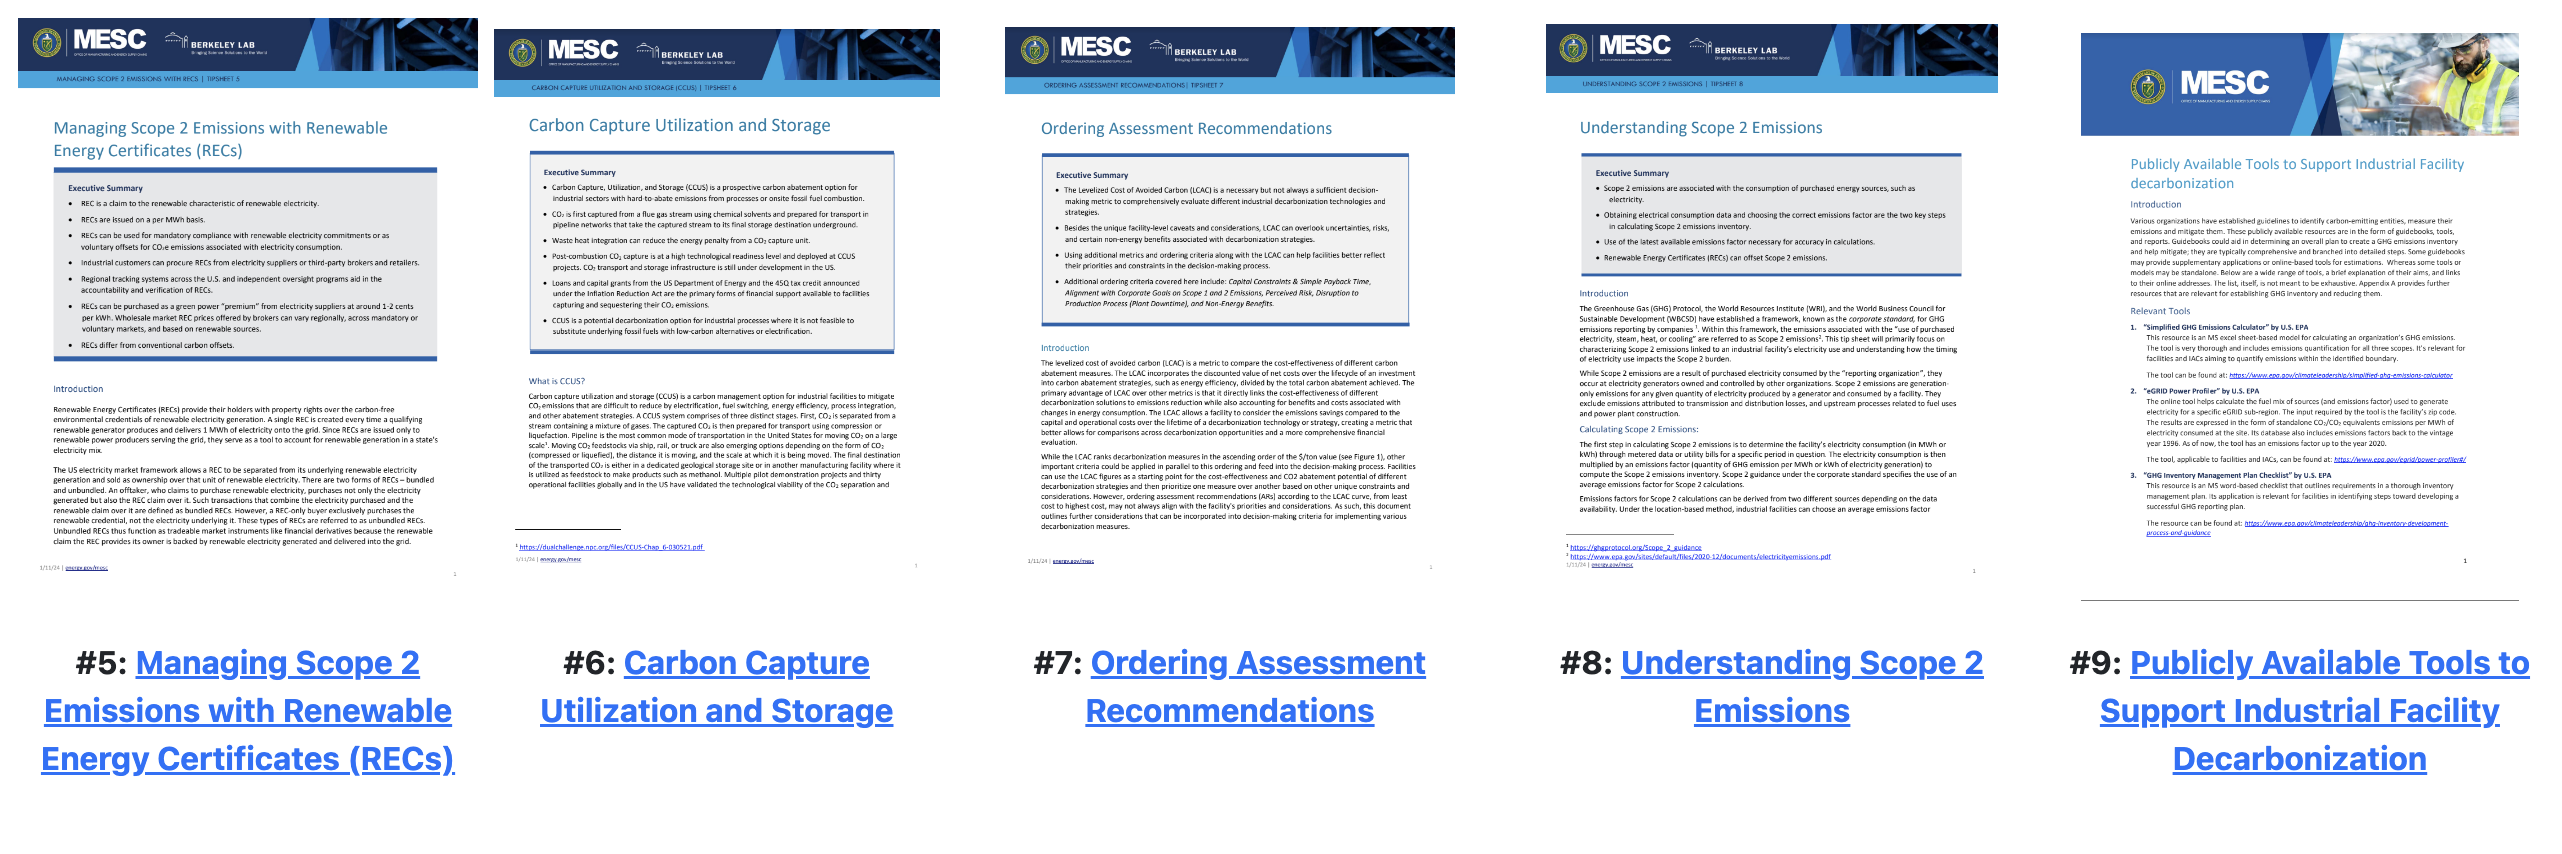
We offer nine tip-sheets and primers that provide a basic understanding of non-energy benefits of energy conservation technologies, processes and strategies that can help facilities achieve significant energy, cost, and emissions reductions.
Check out these tip-sheets.
|
Technology Tip-Sheets |
Strategy Tip-Sheets |
 |
 |
This project is part of a joint effort between Lawrence Berkeley National Laboratory (Berkeley Lab) and the UC Davis Energy and Efficiency Institute (UC Davis EEI). Visit their websites to find out more about the innovative energy-related work conducted by Berkeley Lab and UC Davis EEI.
 |
 |
|||||
 |
 |
 |
 |
 |
 |
 |
|
Prakash Rao Head of Building & Industrial Applications Department |
Unique Karki Energy/Environmental Technology Researcher II
|
Kelly Kissock Faculty Director, Energy and Efficiency Institute |
Ovais Khan Master’s Student |
Muhammad Ali Qamar PhD Student |
Nikunj Bhartia Master’s Student |
|
FST: Khan, Ovais, Ali Qamar, Muhammad, Karki, Unique, Sinha, Vedant, Kissock, John, Rao, Prakash. (October 2023). Facility Sankey Tool (FST) v0.9. [Computer software]. https://github.com/IACDecarb/IAC-Decarb-Tools. https://doi.org/10.11578/dc.20240813.3.
LCC: Ali Qamar, Muhammad, Khan, Ovais, Karki, Unique, Sinha, Vedant, Kissock, John, Rao, Prakash. (October 2023). Levelized Cost Curve Tool (LCC) v0.9 [Computer software]. https://github.com/IACDecarb/IAC-Decarb-Tools. https://doi.org/10.11578/dc.20240807.3
PIT: Khan, Ovais, Ali Qamar, Muhammad, Karki, Unique, Kissock, John, Rao, Prakash. (March 2025). Pinch Heat Integration Tool (PIT) v0.9. [Computer software]. https://github.com/IACDecarb/IAC-Decarb-Tools.
ELPT: Karki, Unique, Sinha, Vedant, Kissock, John, Rao, Prakash. (March 2025). Electric Load Planning Tool (ELPT) v0.9. [Computer software]. https://github.com/IACDecarb/IAC-Decarb-Tools.
